Introduction
In this project, we examined various NLP techniques to analyze tweets about the 2020 election. The primary areas we explored were topic modeling and tweet classification by political party leaning, but we simultaneously looked into sub-problems within these. For example, we compared datasets of differing sizes to examine the impact of training set size on often noisy language data, like tweets, which often have words not common in a lot of training corpuses. We also examine the location distribution of Twitter users who support one party or another.
Data Collection
Overview
Our team used political tweet datasets, election tweet datasets, and Twitter feeds for well known politicians to gain insights from the areas we wanted to explore. Our very first version of the dataset was made of tweets from hand selected Democrats and Republicans on Twitter that we would mine from election datasets. However, as we went further in the project, we were introduced better APIs and archives that allowed us to get more structured data. As most of the datasets of tweets contain the IDs and omit the other information for privacy purposes, we were required to use the Twitter API in conjunction with Hydrator to retrieve the full tweet.
Dataset for 2020 Election Tweets
Our very first dataset was nearly 2000 tweets that we extracted from the IEEE 2020 political election dataset. We indexed each of our hand selected users’ ids into the dataset to get tweets from the users. We then hydrated the tweets using Hydrator to create our final dataset.
Dataset for 2020 Tweets from Congressional Entities
We relied on Twitter feed archives for committees, caucuses, parties, and members of Congress to form our 2020 political tweets dataset. We then were able to add a party label to the each of the tweets based on the political leaning of the respective committee, caucus, party, or member. This allowed us to find a labeled dataset of political Tweets from the year of 2020 of size 500,000, which then allowed us to try more complex models to solve party classification from tweets.
We got the archives of all political tweets from this GitHub repository, which has all tweets by date in JSON format. We got the twitter information and party leaning of each of the political members from this <a href=https://alexlitel.github.io/congresstweets/>link</a>, in JSON format. We then combined the two to create a dataset that has each labled by party of either Democrat or Reublican. Our final dataset had a column for the tweet text, including hashtags as well as mentions, and the political affiliation of the user who tweeted the tweet. This large text corpus of 500,000 political tweets all from the year 2020 enabled us to try classifying what party a tweet leans more towards as well as to look at the most important issues addressed in political tweets.
Topic Modeling of Election Tweets
Overview
In addition to making election predictions based off of Twitter data, we also wanted to gauge which topics were driving the discourse of the election on Twitter. To do this, we used a topic modeling strategy on four separate datasets consisting of Democrat, Republican, Green Party, and Libertarian affiliated tweets. This allowed us to identify the people, policies, and ideas that motivated each respective party in the 2020 Presidential Election.
To extract topics from a set of tweets we used an automated keyword extraction technique with Natural Language Processing (NLP). These keywords were used as categories to narrow down the focus of a tweet. We began this process by preprocessing the text from all of the tweets in the dataset. Using the list of stopwords in the NLTK library as well as some of our own, we defined irrelevant text that could be ignored in the tweets. This included information such as account names, basic prepositions, and other filler words that did not have significance to the message of the tweet. Then, with all unnecessary words removed, we continued on to remove all punctuation, numerals, and other special characters such as emoticons. Our final preprocessing step was to normalize the text through stemming and lemmatization. These methods handle multiple representations of the same word, and convert each instance to a common root word. This way, when finding the most common topics discussed within the dataset, each word is properly represented.
At this point our data was ready to be processed. We used the bag of words model, which focuses on how often a word reoccurs in the text rather than the sequence words occur in. Using the Count Vectorizer library from sklearn, we tokenized the text from all of the tweets in our dataset. Then, using the returned vector, we calculated the frequency of bigrams, or sequences of two words, across the dataset. Choosing to use bigrams allowed us to find several distinct topics that were discussed regarding the election, whereas unigrams provided too little information and trigrams were unreliable given the already compact nature of tweets. These bigrams were then plotted in order of their frequency, allowing us to visualize the importance of certain topics and candidates to each individual party.
Democrats
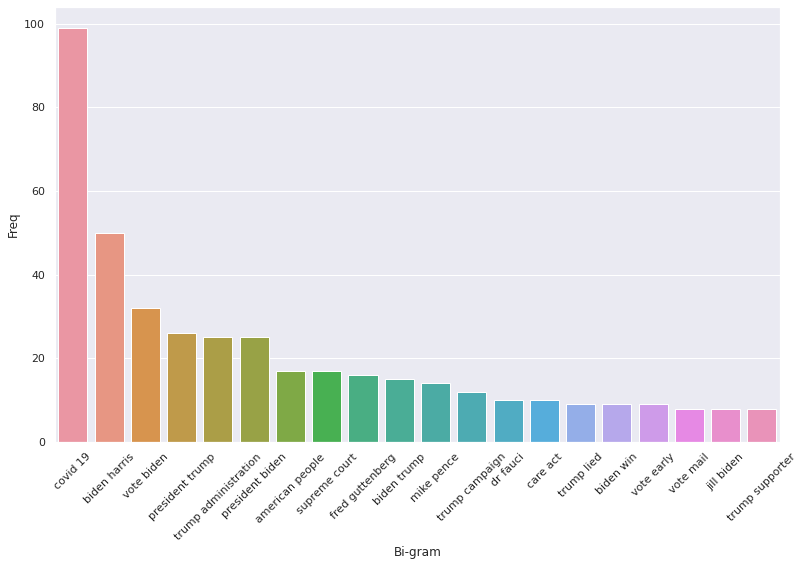
Looking at the most common topics from Democrat affiliated accounts, we can clearly see the most important issues to the party for the 2020 election. With the COVID-19 pandemic far exceeding any other topic, even the candidates for the election, it is clear that the Democratic Party placed a greater emphasis on current pressing issues in America than their nominees. Additionally, we can see the Democratic Party’s urgency to encourage citizens to vote with topics such as “vote Biden”, “vote early”, and “vote mail” each appearing numerous times throughout the dataset. From this graph alone, it is clear that healthcare and the current state of the pandemic in the nation was one of the main driving forces of the party during this election cycle, evidenced by topics such as “covid 19”, “dr fauci”, and “care act”, which refers to the Affordable Care Act enacted by the Obama administration. The Democrats distrust for Republicans, and specifically Trump, is also shown in this graph, since “trump lied” is among the leading topics from the dataset. Therefore, through this visualization of the Democratic tweets leading up to the election we can clearly see a snapshot of the political discourse within the party.
Republicans
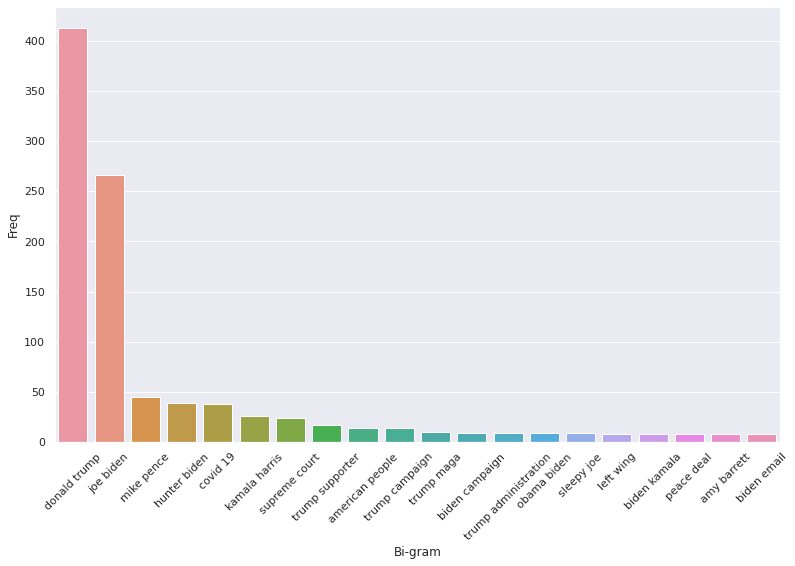
After repeating the same process of keyword extraction with a Republican centric dataset, we can see a stark difference in the importance of topics between the Republican and Democratic parties leading up to the election. The Republicans were clearly much more candidate-oriented, with their focus being on Donald Trump himself rather than policies or current events in the nation. Many of the topics listed in the graph above are focused on specific individuals, whereas the Democratic graph, while still having an emphasis on Trump and Biden, also focused on other policy issues in the country. Similarly to the Democratic Party’s graph, we can also see the Republican Party’s distrust for their opponents. With some of the common topics being “hunter biden”, “sleepy joe”, and “biden email”, we can get a glimpse at the accusations made against Joe Biden and his family leading up to the election, and the importance each took on within the party. For example, the graph illustrates that Hunter Biden was a rather large focus for the Republican Party, as they sought to explain their suspicions regarding Joe Biden’s son to potential voters. Ultimately, the Republicans focused more on the individuals directly involved in the presidential race, as opposed to the Democrats, who focused more on current events.
Green Party
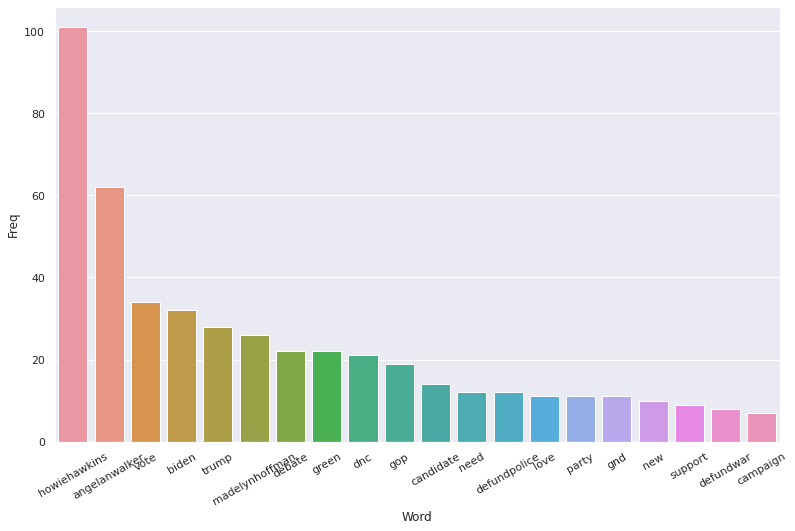
For the Green Party we reverted to focusing on unigrams, as the limited tweets available for this dataset was not conducive to a bigram setting. Through these unigrams we can see that the Green Party placed an emphasis on their own nominees, Howie Hawkins and Angela Walker, while focusing less on Biden and Trump. We can also get a sense of the beliefs of the Green Party, with policies such as defunding police and war as well as “gnd”, or the Green New Deal, being the party’s most prominent policy points.
Libertarian Party
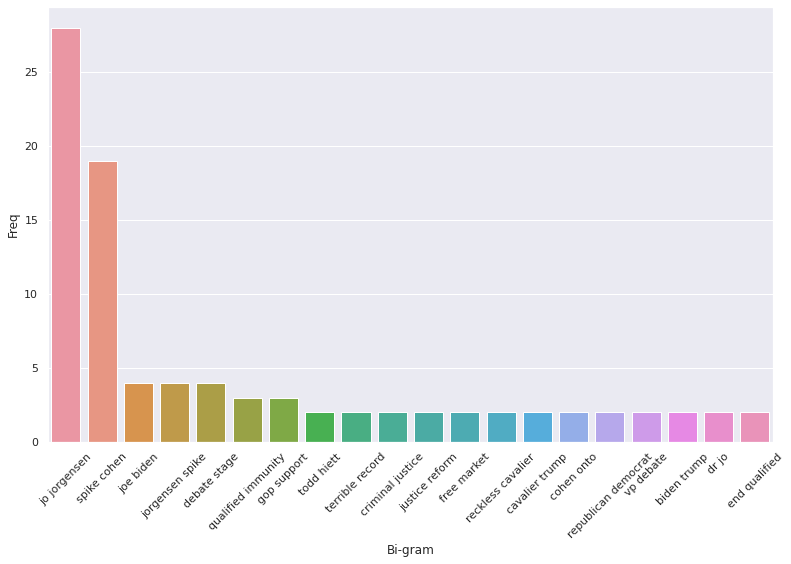
Finally, we can see the most prominent subjects for the Libertarian Party heading into the election. As with the other parties, the Libertarians focused mostly on their nominees, Jo Jorgensen and Spike Cohen, trying to encourage American citizens to vote for them. We also see that the Libertarian Party focused more on criminal justice than their competitors, with topics such as “qualified immunity”, “criminal justice”, and “justice reform” being among the most prominent. From this alone we can see a clear departure from the focuses of other parties.
In conclusion, utilizing NLP to filter the content of tweets allowed us to extract common keywords that occurred throughout the dataset with a bag of words model. These keywords were then paired to create bigrams (in all cases except for the Green Party), which, when graphed by frequency, gave a strong insight into the priorities of each distinct party and the direction they desired the nation to follow. With these newfound understandings of the intentions of each party, we can also extract the desires of certain users or collective states overall by identifying which party they most align with according to their tweets. Therefore, we can not only point to their political affiliation in broad terms, but also pinpoint which policies and ideals they are likely to most align with.
Topic Modeling of 2020 Politician Tweets
Our team wanted to see what the most important topics that Congressional entitities tweet per party tweet about as a whole and to see frequently occuring terms. By combining topic modeling with sentiment analysis and other analysis tools, we can learn a lot about the current political atmosphere. From our topic modeling of 2020 politician tweets, we can help machine learning models have additional context of a tweet to help classify what party a tweet leans towards. We can even conduct an analysis of the top topics on twitter in alongside other national or international events for people interested in understanding how tweets relate to political events.
Topics Extracted by LDA
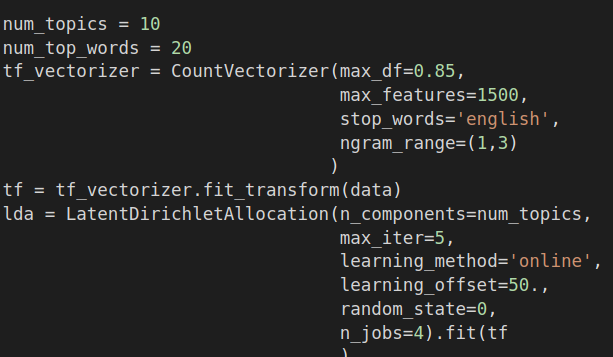
The first step we took for our topic modeling was to look at the to 10 topics tweeted about by both Democrats and Republicans. For this step, we used sklearn’s CountVectorizer to vectorize tweets then LatentDirichletAllocation to group tweets together by top 10 models in an unsupervised fashion. We also attempted topic modeling with TFIDFVectorizer and NFM packages, and we also got well defined topics from that model as well. The code snippet for the LDA is shown below:
After training both the vectorizer and the LDA model, we got the following top 10 topics:
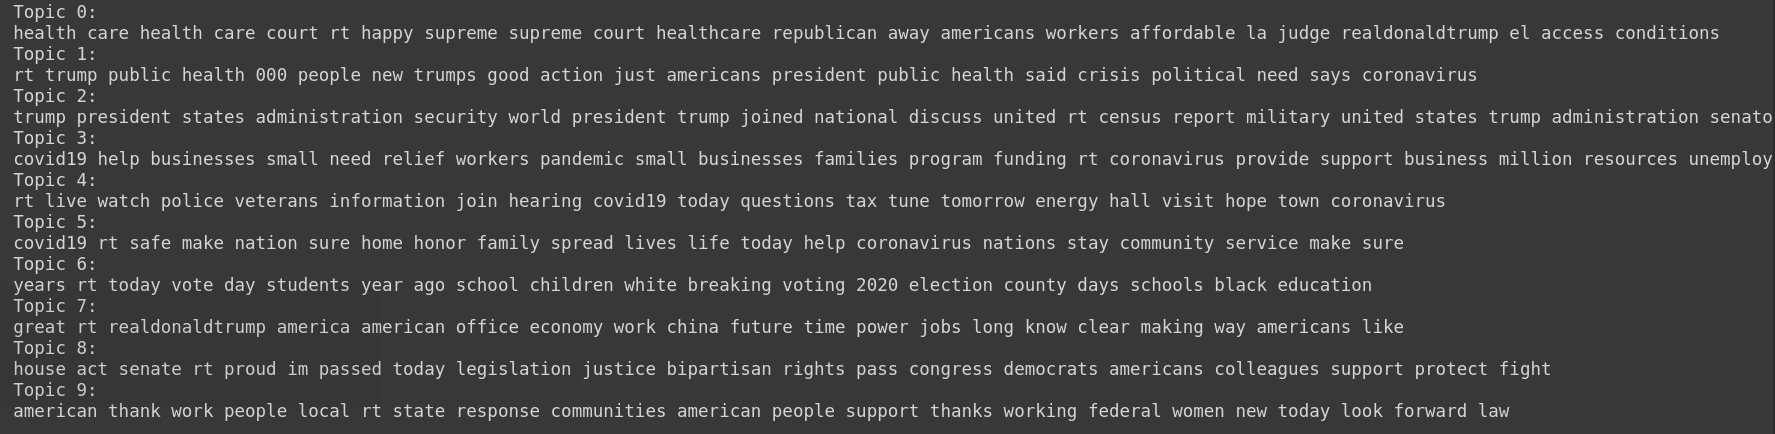
As we can see from the image, there is a clear division in the topics. Using human interpretation of the clustering of words, we can organize the topics into the following categories:
- Affordable healthcare
- Public health actions taken for the crisis
- National security and the military
- Support for small businesses, families, and unemployed people because of Covid
- Municipal related tweets
- Save lives, stop the spread
- Voting, old time school segregation
- Donald Trump American labor jobs
- Pushing for a legislation
- American men and women supporting
Furthermore, our topic model was able to catch that coronavirus has had a strong impact on many topics, ranging from jobs, health care, school, businesses, as it is mentioned in those topics. This provides much better groupings of topics than splitting on a keyword such as “Covid” would, in our example. Furthermore, a machine learning model can take these topics and analyze the sentiment of the tweet to get a wholesome context around the tweet.
WordCloud (Top n-grams) For Republican and Democratic Tweets, Hashtags, and Mentions
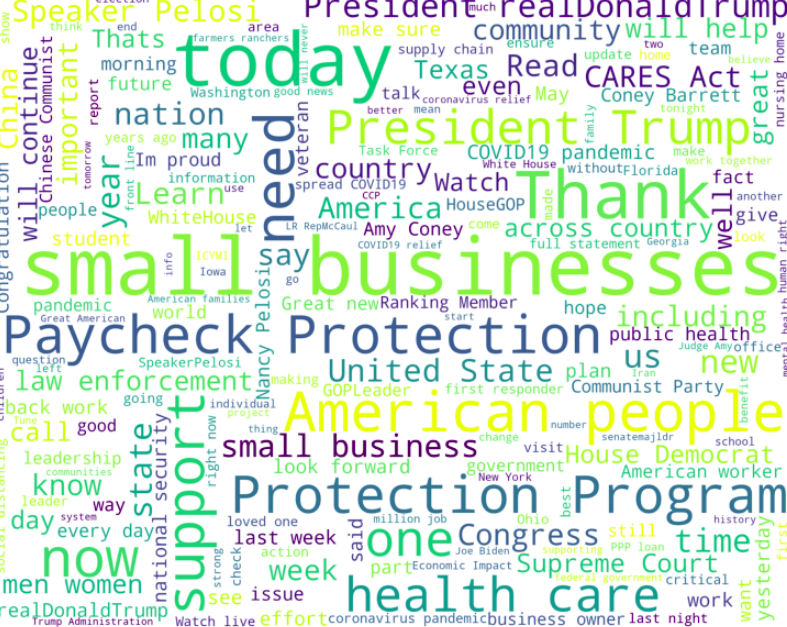
After looking at the main topics between Republicans and Democrats, we wanted to see what terms or phrases each party is more likely to use in their tweets. Thus, we decided to create word clouds for each respective party’s tweets, hashtags, and mentions. Given word clouds, one can examine the different phrases each party uses to better understand the differences in language between the two parties.
Republican Tweets
We can see here that Republicans are more likely to tweet about the protection program and mention small businesses. This is expected because these two topics are heavily on their agenda. We also see Republican dominated states such as Texas and Georgia on the word cloud.
Republican Hashtags
We see here that Covid19 is the biggest as well as PaycheckProtectionProgram. What is interesting is that Republicans have hashtags about veterans, oil companies, foreign policy, etc.
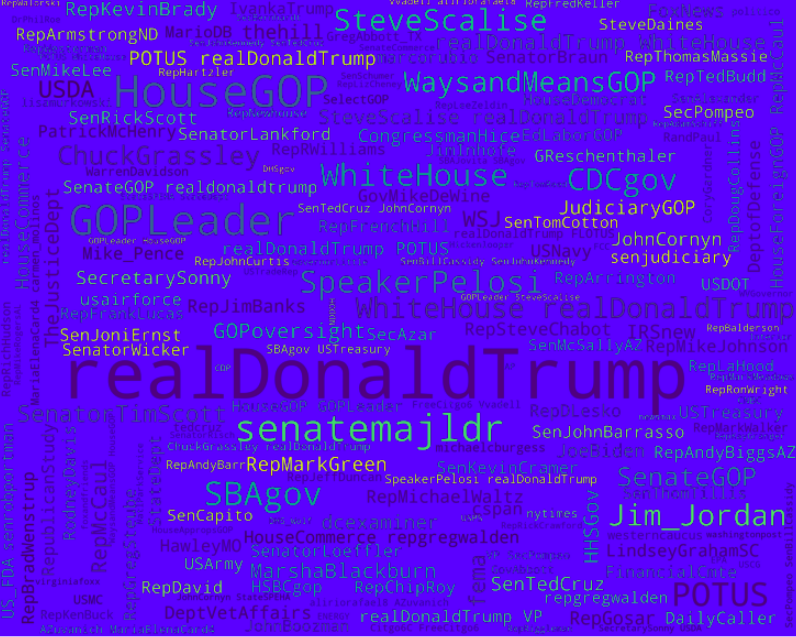
Republican Mentions
We see here that Republicans mention realDonaldTrump disproportionately more than other posts. This is because members of the same party often retweet each others posts to commend their successes. Furthermore, as expected, we see that Republicans often mentioned other Republicans in their tweets.
WordCloud (Top n-grams) For Democratic Tweets, Hashtags, and Mentions
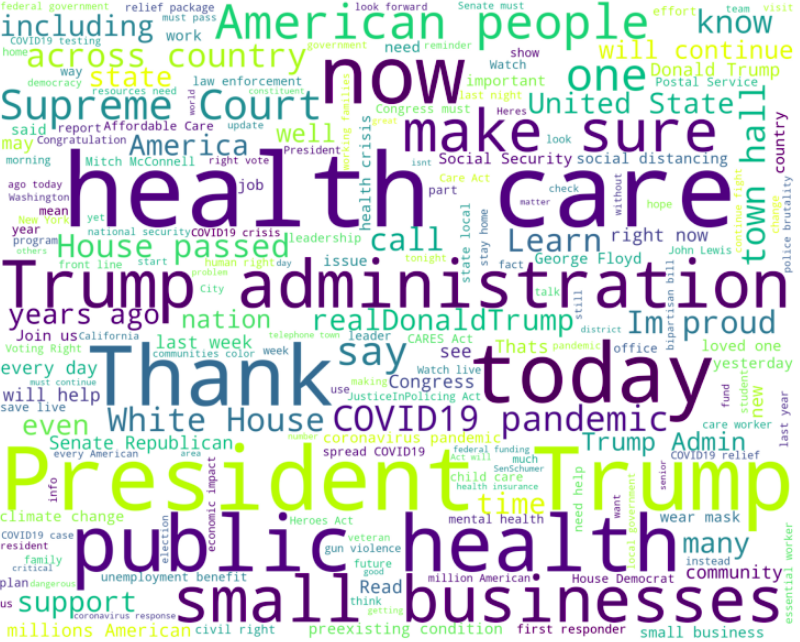
Democratic Tweets
We see that Democrats tweet about health care, public health, the trump administration, and small busineses the most. What is interesting is that Democrats on twitter say the “Trump Administration”, which carries somewhat of a negative connotation, while Republicans tend not to say it at all.
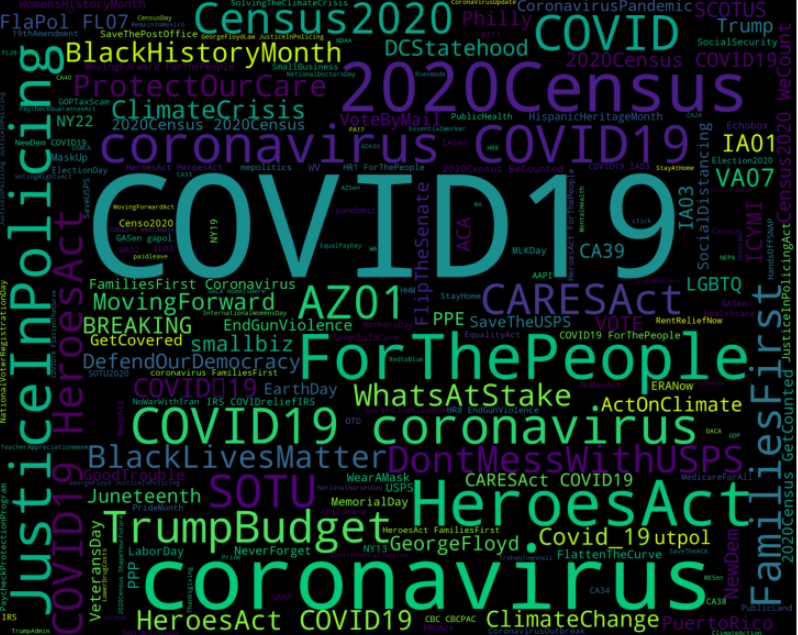
Democratic Hashtags
Some interesting hashtags that the WordCloud caught onto ActOnClimate, FamiliesFirst, Juneteenth, ClimateChange, ClimateCrisis, ProtectOurCare, and more that are well known to fall under the liberal spectrum.
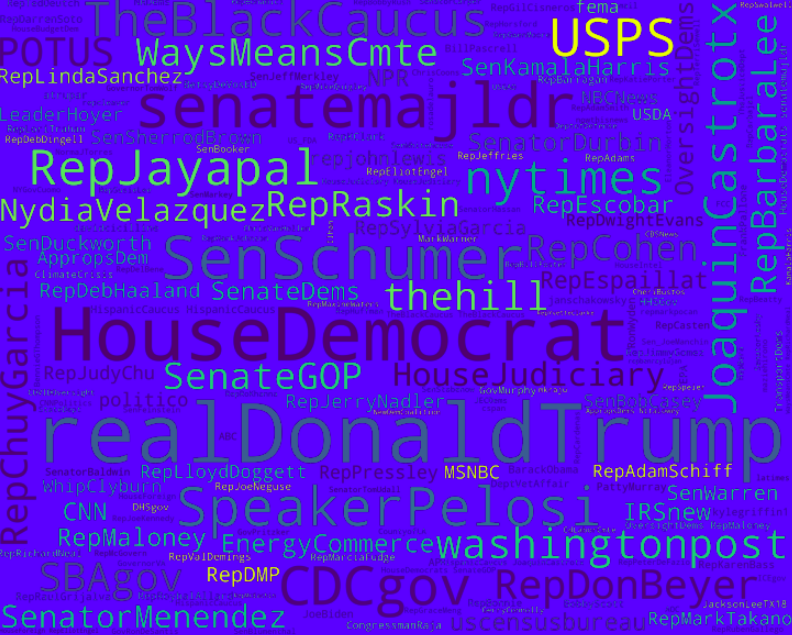
Democratic Mentions
We see that Democrats are more likely to retweet HouseDemocrats, as well as other democratic congressmen and congresswomen.
Final Thoughts
The vectorization and LDA pair allowed us to generate realistic topics within our dataset. A possible area improvement is our n-gram generation and word inverse frequence weights. In the future we can improve our vectorization tool to provide more information packed n-grams and choose a topic model that is more natural. In the future, we combine our topic modeling with the sentiment for each party around each of our extracted topics to get insights into the political environment solely from tweets.
Classification With a Small Dataset (1 - 2k Rows)
Overview
This section covers our efforts to create a classification model to predict party leaning of either Democrat or Republican given the tweet text for a small version of our dataset focusing on the 2020 election. We only had about 2000 labeled tweets, which is comparatively small for a language classification dataset, so we were curious whether BERT would be able to learn enough to produce classifiable embedding.
Tweet Preprocessing
Before diving into the models, we wanted to make sure to provide our BERT models with well formatted sentences with special characters and URLs ommitted. Our tweet preprocessing was standard across training the machine learning models around the 2020 political tweets dataset. Our preprocessing consisted of removing the ‘#’ and ‘@’ symbols, denoting hashtag and mention respectively, and keeping only the text that immediately followed them. We wanted to keep the text following the symbols because they provide contextual information around a tweet that can help humans and machines alike understand the tweet better. Furthermore, BERT already has a robust text preprocesser in it’s tokenizer module, so we let the BERT tokenizer carry the weight of preprocessing the rest of the text.
Getting Started With BERT
To start off with, we knew we wanted to embed the tweets we got using an existing language model. We could have chosen smaller, simpler models like word2vec, GloVe, or ELMo, but due to the easy availability of state-of-the-art Transformer-based models like BERT from huggingface, we ended up choosing BERT.
Instantiating a BERT model from huggingface was extremely simple. All it took was installing the transformers package and a couple lines of code:
from transformers import BertTokenizer, BertForSequenceClassification

tokenizer = BertTokenizer.from_pretrained('bert-base-uncased',
                                           do_lower_case=True)
model = BertForSequenceClassification.from_pretrained('bert-base-uncased')
Essentially what this code does is provide us with a tokenizer and the BERT model itself. The tokenizer is necessary as the BERT model does not take raw text, but instead encoded tokens based on pre-trained word embeddings. Both the model and the tokenizer were instantiated from pre-trained weights provided by huggingface - bert-base-uncased, a smaller version of the model used in the BERT paper that still provides good results and is easier to train on less powerful hardware. In addition, since we used the BertForSequenceClassification class, we get a logistic regression layer added for free to aid in our classification task.
To use these, first we needed to clean our tweets, which we did using the tweet-preprocessor module plus some extra regex to remove punctuation and numbers. Then, we needed to tokenize and encode them, which we did like so:
encoded_data_train = tokenizer.batch_encode_plus(
    dataset_clf[dataset_clf.data_type=='train'].clean_text.values,
    add_special_tokens=True,
    return_attention_mask=True,
    padding=True,
    truncation=True,
    return_tensors='pt'
)

input_ids_train = encoded_data_train['input_ids']
attention_masks_train = encoded_data_train['attention_mask']
labels_train = torch.tensor(dataset_clf[dataset_clf.data_type=='train'].label.values)
This code added in some important things. Namely, the [SEP] and [PAD] tokens that help BERT identify the end of a sentence, as well as the [CLS] token that signifies the start of the sentence and BERT embeds into a 768-dimensional space as an embedding for the entire sentence. Here is a great representation of this from this article:
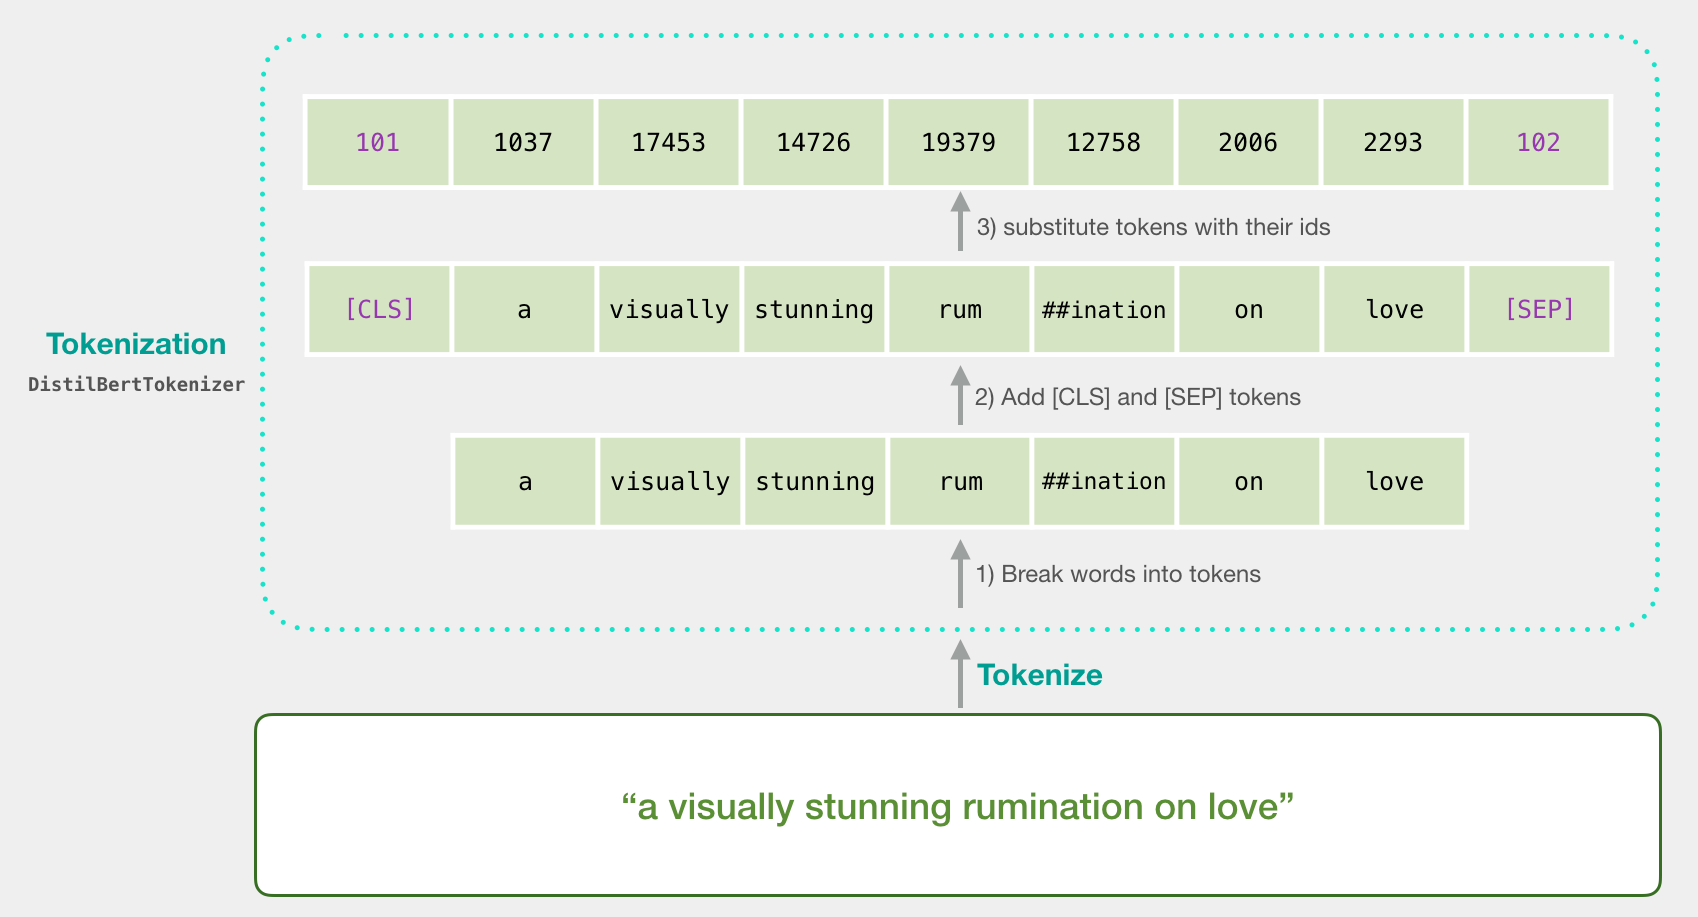
Great, we now had PyTorch tensors to train with. The next step was to fine-tune our model. We created a training loop in vanilla PyTorch, using the AdamW optimizer with learning rate of 1e-5 and epsilon of 1e-8. We also started off with a batch size of 8 and trained for 5 epochs.
 |
 |
|---|---|
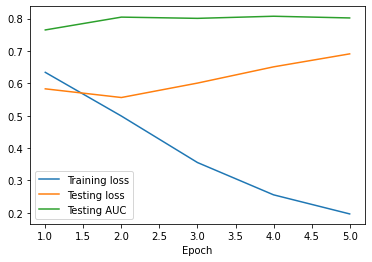
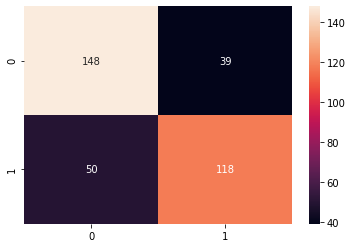
| Metrics over 5 training epochs | Confusion matrix |
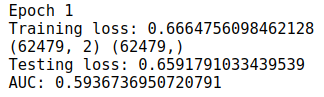
We first tried a multi-class classification problem that involved Democrats, Republicans, Libertarians, and the Green Party, but ended up with almost 0% accuracy on the Libertarian and Green Party test samples (most likely due to the small number of data available and similarity of these tweets to the Republican and Democrat tweets), so we decided to focus on a binary classification problem between Republican and Democrat. This resulted in a final cross-entropy loss of 0.69, AUC of 0.80, and accuracy of 0.749. However, as you can see in the above graph, it appears that the testing loss is increasing past epoch 2, while the training loss is decreasing. This indicates overfitting, which we then tried to fix with hyperparameter tuning.
Hyperparameter Tuning
Tuning deep learning models, we learned, was not as easy as tuning something like XGBoost or CatBoost, as there was no simple interface to sklearn’s GridSearchCV or similar utilities for PyTorch models. We tried skorch and huggingface’s Trainer class, which has built in tuning powered by Ray Tune, but ran into problems with both. In the end, we ended up writing a custom script that used Ray Tune directly, along with ASHA scheduling and the HyperOpt search algorithm, which implements tree-structured Parzen estimators to provide better suggestions for searching the configuration space. Also, we made sure to implement cross-validation with sklearn’s StratifiedKFolds to ensure we didn’t pick our best parameters from a drop in loss by chance.
Here was the first search space we tried:
config = {
    "lr": tune.loguniform(1e-6, 2e-5),
    "eps": tune.loguniform(1e-10, 1e-7),
    "weight_decay": tune.loguniform(1e-10, 1e-5),
    "batch_size": tune.choice([4, 8, 16, 32]),
    "epochs": tune.choice([2, 3, 4, 5])
}
Unfortunately, we were not able to find a model that performed significantly better using this space. We then tried just tuning over lr, batch_size, and epochs, as these were the only three parameters explicitly mentioned for fine-tuning in appendix A.3 of the BERT Paper.
config = {
    "lr": tune.choice([5e-5, 3e-5, 1e-5, 2e-5]),
    "batch_size": tune.choice([8, 16, 32]),
    "epochs": tune.choice([2, 3, 4])
}
We ran 8 experiments using this search space. Here is a graphical summary of the session:
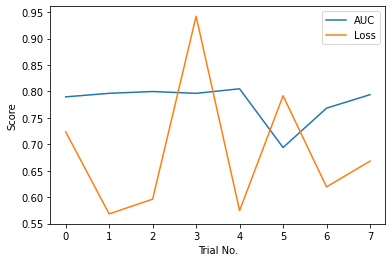
We then identified trials 1 and 4 as promising, and evaluated both on the same 85/15 train-test split. Trial 1 achieved an accuracy of 0.752, AUC of 0.830, and testing loss of 0.549. On the other hand, Trial 2 did a little worse, with an accuracy of 0.732, AUC of 0.821, and test loss of 0.567. Due to this, we ended up going with the parameters from Trial 1, which are the following:
| Batch size | Epochs | Learning rate |
|---|---|---|
| 16 | 2 | 2e-5 |
Final Thoughts
It appears that, even for small datasets, BERT is able to produce sentence embeddings that have a decent level of linear seperability, enough to be learned to a significant level by a simple logistic regression. This is promising, as researchers can easily evaluate recent political topics on Twitter that only have a small corpus of tweets with a fast-training model. In the next section, we explore the impact of a larger dataset on the performance of BERT to seperate broader political tweets.
Classification with Big Dataset (5k - 50k rows)
Overview
This section covers our efforts to create a classification model for a large version of our dataset focusing on the 2020 tweets from politicians. In this dataset, we had over 500,000 tweets, which is significantly larger than our small dataset mentioned in the previouis section. We split the entire dataset into training and testing using an 85/15 split. We then randomly sampled 5k, 10k, and 50k samples from our training split to train our model on and evaluated our performance on the other 15%. Our goal was to find out whether BERT could learn an accurate way to produce classifiable embeddings given more data.
Procedure
To run BERT on the large dataset, we utilized the same techniques as we did for the small dataset.
We preformed the same data cleaning techniques and initialized BERT in the same way. Likewise, as with the small dataset, we employed our custom script that used Ray Tune directly, along with ASHA scheduling and the HyperOpt search algorithm. Similarly, we also made sure to implement cross-validation with sklearn’s StratifiedKFolds to ensure we didn’t pick our best parameters from a drop in loss by chance.
We found that this large dataset was too big for Google CoLab’s GPU to handle, as it would take an excessive amount of time, causing timeouts in our sessions, and even cause errors and failures while running. To combat these obstacles, we broke down our large dataset into smaller datasets of sizes 5k tweets, 10k tweets, and 50k tweets and analyzed those. In addition, we broke it down into smaller datasets to track the improvement of AUC as our dataset increased.
For each of these subsets, like before, we then tried just tuning over lr, batch_size, and epochs, as these were the only three parameters explicitly mentioned for fine-tuning in appendix A.3 of the BERT Paper.
For reference, here’s the configurations that we used to hyperparameterize our models.
config = {
    "lr": tune.choice([5e-5, 3e-5, 1e-5, 2e-5]),
    "batch_size": tune.choice([8, 16, 32]),
    "epochs": tune.choice([2, 3, 4])
}
To find the best parameters, we ran 8 experiments for each of the three subsets. For each subset, 5k, 10k, and 50k tweets, we identified the models that had hyperparameters with the highest AUC values and evaluated them on the same 15% test data from the 85/15 train-test split. We found the following parameters to be the most optimal for all three:
| Batch size | Epochs | Learning rate |
|---|---|---|
| 8 | 3 | 2e-5 |
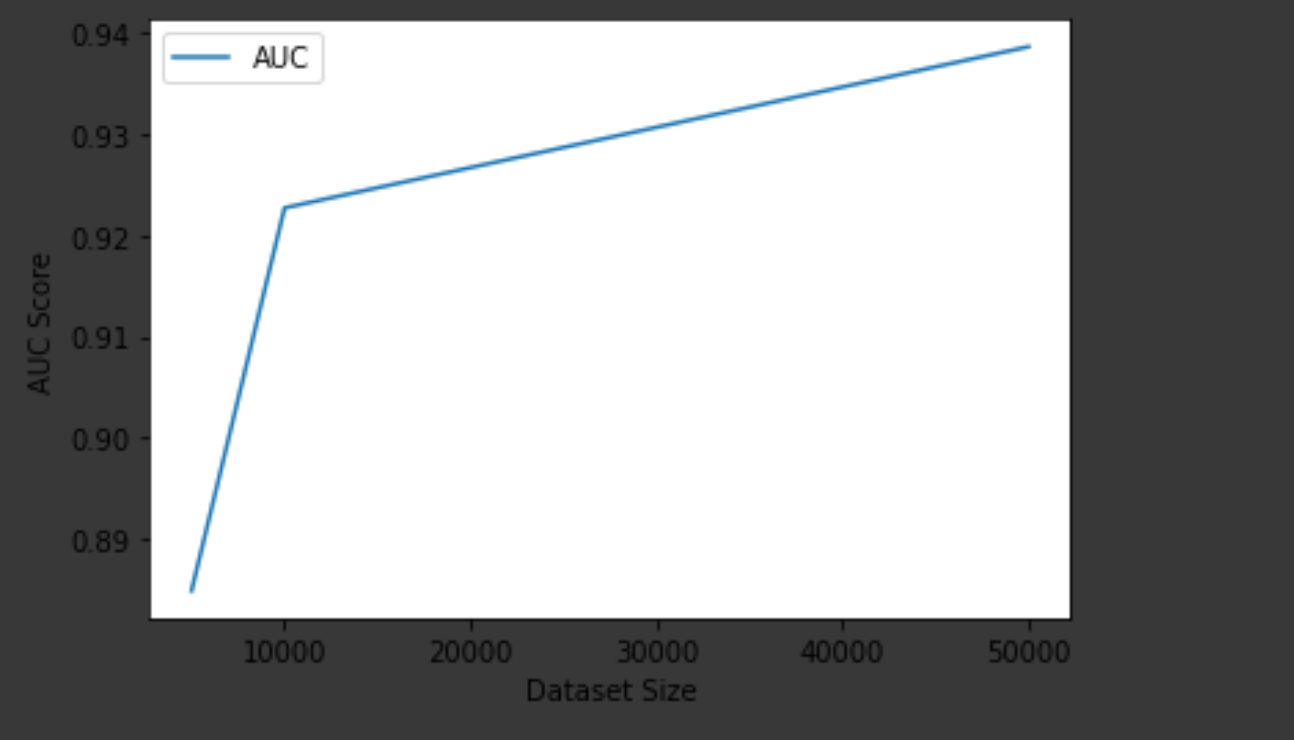
With these hyperparameters, we found that the AUC to steadily increase as the dataset size increased. We found the optimal AUC on the test sets with these hyperparameters to be: 0.8849032763385403, 0.9227300126640381, 0.938660206530352 for the 5k, 10k, and 50k sets respectively. The graph below illustrates the increase in AUC score with respect to dataset size.
Final Thoughts
As shown above, it seems that BERT is able to produce accurate sentence embeddings that have a good level of linear seperability that can be learned to a significant level by logistic regression, even more so with larger datasets. These results are extremely promissing, as we have found a way to accurately categorize political tweets as Democratic and Republican, just from the content of the tweet itself. This is extremely promising and useful, as these models can be used to help predict election results, which we will explore and discuss in the next section.
Other Classifiers and Approaches
We thought that there may be a possibility the embeddings from BERT happened to not be linearly seperable, and thus unable to be separated by the logistic regression classifier on top of BERT in the Sequence Classification model we were using. We thus attempted to use non-linear models to classify the BERT embeddings. We first tried an MLP architecture defined by the following:
class MLPClassifier(torch.nn.Module):
  def __init__(self):
    super(MLPClassifier, self).__init__()
    self.hidden = torch.nn.Linear(bert.config.hidden_size, 128)
    self.output = torch.nn.Linear(128, bert.config.num_labels)

  def forward(self, x):
    x = self.hidden(x)
    x = F.relu(x)
    x = self.output(x)
    return x
However, this showed at best, worse to equal performance compared to our simple linear classifier. We also tried an XGBoost model trained and tuned over the output features from BERT of our training data. Unfortunately, this did significantly worse than both other approaches. Ultimately, in the interest of time, we selected our hyperparameter-tuned simple linear classifier stacked with BERT as our best model for political tweet classification on small datasets. Although, given more time, it would have been interesting to play around with the number of hidden layers and hidden layer sizes in our MLP architecture to see if we could produce a better model.
Another approach that we tried was employing the “bert-large-uncased” pre-trained model in addition to the “bert-base-uncased” model. To start off, we tested out the larger BERT model for our small dataset, the one with around 2,000 tweets. However, we quickly found that this caused testing and hyperparameter tuning to take considerably longer. In addition, the increase in AUC we obtained from using the large BERT model was extremely small, around only a 0.001 increase. Because of this, we decided to make a tradeoff between performance speed and a small increase in AUC, choosing performance speed given our limited time and resources to complete the project.
Classification with Very Big Dataset
This section covers our efforts to train the BERT sequence classification model with a larger training text corpus of nearly 150,000 entries. Our findings were that training on a larger corpus yielded better classification that the previous section’s models on the validation set from the previous section . We will detail the steps we tried when fine-tuning with a large dataset. We used the same train-test split as mentioned in the previous section, and sampled 150,000 tweets from the training region, and kept the same 15% of test tweets to analyze our results.
Fine-tuning BERT Sequence Classification with Frozen BERT Weights
Our first approach to fine-tune BERT Sequence Classification was to freeze the BERT weights simply because training would take too long if we were to also train the BERT weights. We thus tried this approach of only modifying the weights of the the logistic regression classifier on top of BERT to get the following results:
As we can see from the results, fine-tuning the BERT Sequence Classification model’s logistic regression layer only does not allow it to learn more complex patterns from the text corpus. This could be becuase the logistic regression is not deep enough to catch on to these.
Fine-tuning BERT Sequence Classification without Frozen Weights
We decided to take a go at fine-tuning the whole BERT Sequence Classification model with our large text corpus to get the following results on the same test set as from above. The training was considerably longer, however, we were able to get much better results as shown below.
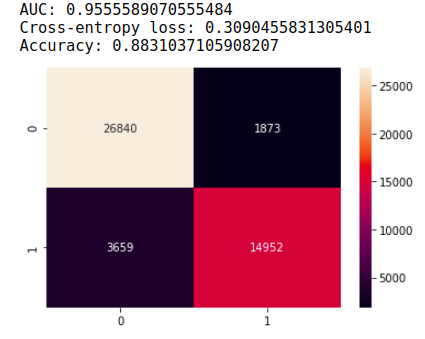
This shows that BERT was able to find patterns that help distinguish Democratic tweets from Republican tweets, vice versa, very well when given more data. Even more remarkable is that it was able to achieve such performance without being fine-tuned. This may be because the variance of the complex BERT model greatly decreased when we fed it large samples of data. Further, it may be that the model is deep enough to learn more complex patterns when given more data points to learn from. This AUC score was phenomenal achievement of the model, showing that BERT is able to learn key differences in the style of tweets of Republicans and Democrats.
Further Analysis of Results
One problem we observed with our problem design is that the training corpus has the same users as the testing corpus. Thus, the model may be learning tweet characteristics of specific groups of users to educate its predictions. However, there is also a chance that the model is picking up on word patterns of different groups of people. A future plan is to dive deeper into the weights of the model and find out the significance of each. Another plan is to see is making sure user ids in the training corpora are not in the test corpora.
Interesting Results from Labeled Tweets
Using our trained model, we were now able to predict whether a tweet leaned Republican or Democrat. Below we display a selection of our results.

The tweet above is mislabeled as Republican, when it is mostly likely Democratic leaning in reality. While this is a negative result, the tweet itself contains many misleading terms such as “best heroes” and “Donald Trump” which led the model to predict Republican.


The above tweets were all labeled correctly. Here we get an illustration of the success of our model and its ability to understand terms that relate to Republicans and Democrats respectively. For example, the model was able to recognize terms such as “Make America great again” as Republican, and attacks such as “trump is a fascist” as Democratic.
Election Predictions
Data Collection
To begin, we used a dataset from IEEE comprised of tweets related to the 2020 Presidential Election. The IEEE dataset housed data from July up until late November, so we narrowed it down to only contain tweets from 22 days before the election all the way to the election, since 22 days before the election is the average start day of early voting. Finally, we collected the IDs of each of the tweets in this dataset and hydrated them to receive their full text, which could later be trained on. Hydrating the tweets also provided us with the user’s location, which could then be used to determine how Twitter users voted by state.
Processing Data
First, we began by cleaning up the tweets that we had hydrated. This consisted of removing unnecessary words and characters, as well as usernames. This is similar to how we cleaned tweets before training BERT. Additionally, we read the location data of each tweet and filtered them to only include the state a tweet was tweeted in. This process helped us make the best predictions.
Getting Labels
A new dataset was created containing only the cleaned tweets as well as their respective locations. With this new dataset, we went through the same process of using our model on the selected tweets to make predictions. We imported the BERT model trained earlier in our project to make these predictions and assign labels to each tweet in our new dataset.
Analyzing Predictions
Now, we created a new dataset with the cleaned tweet, location (state), and the prediction made by our model. With this dataset, we went through tweets by their state, and found the amount of Democratic and Republican tweets for that respective state. Another new dataset was created, this one organized by state, containing the “vote” or tweet counts for both parties in each state. Below is a section of this dataset, sorted in alphabetical order:
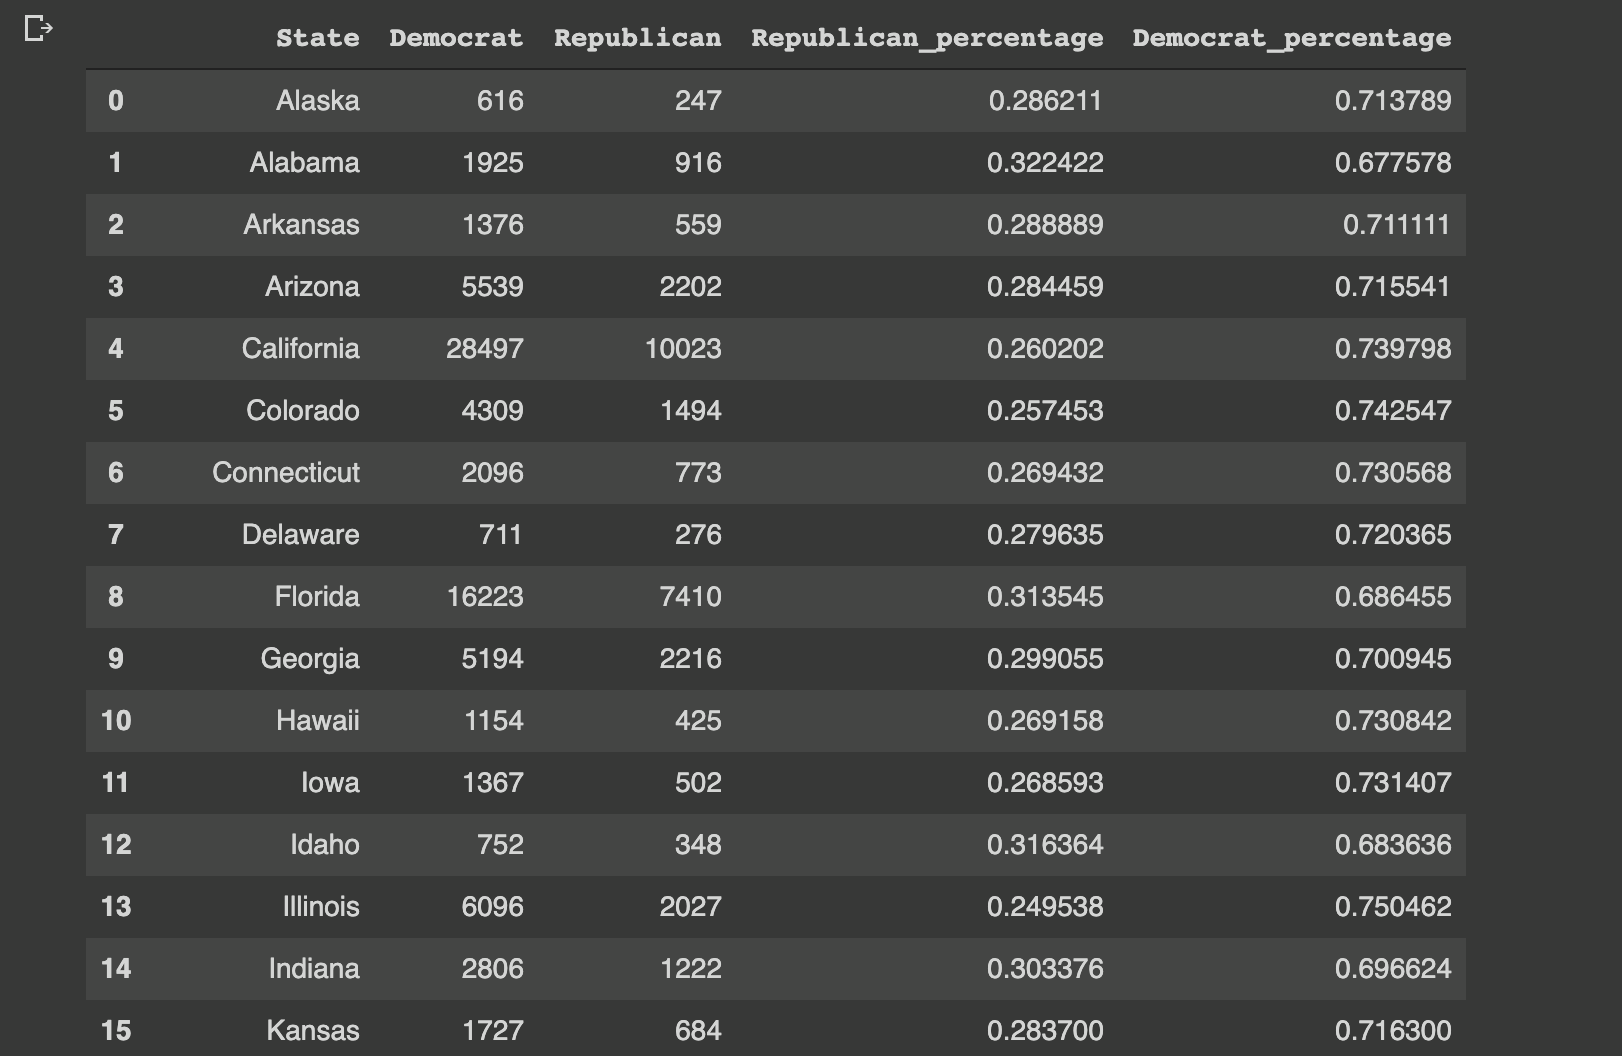
As is apparent igure above, every state had a majority of Democratic leaning tweets, resulting in all fifty states being represented as Democratic in our model. While this may be inaccurate in reality, this result is to be expected, given Twitter’s strong left-leaning user base. More information about Twitter’s Democratic bias can be found in this article: https://www.pewresearch.org/internet/2019/04/24/sizing-up-twitter-users/?fbclid=IwAR24phc18jN9YdApo19PxbjacP2qujtmrIiAVoEi1c2BrbtW0h_POCbQ-lA
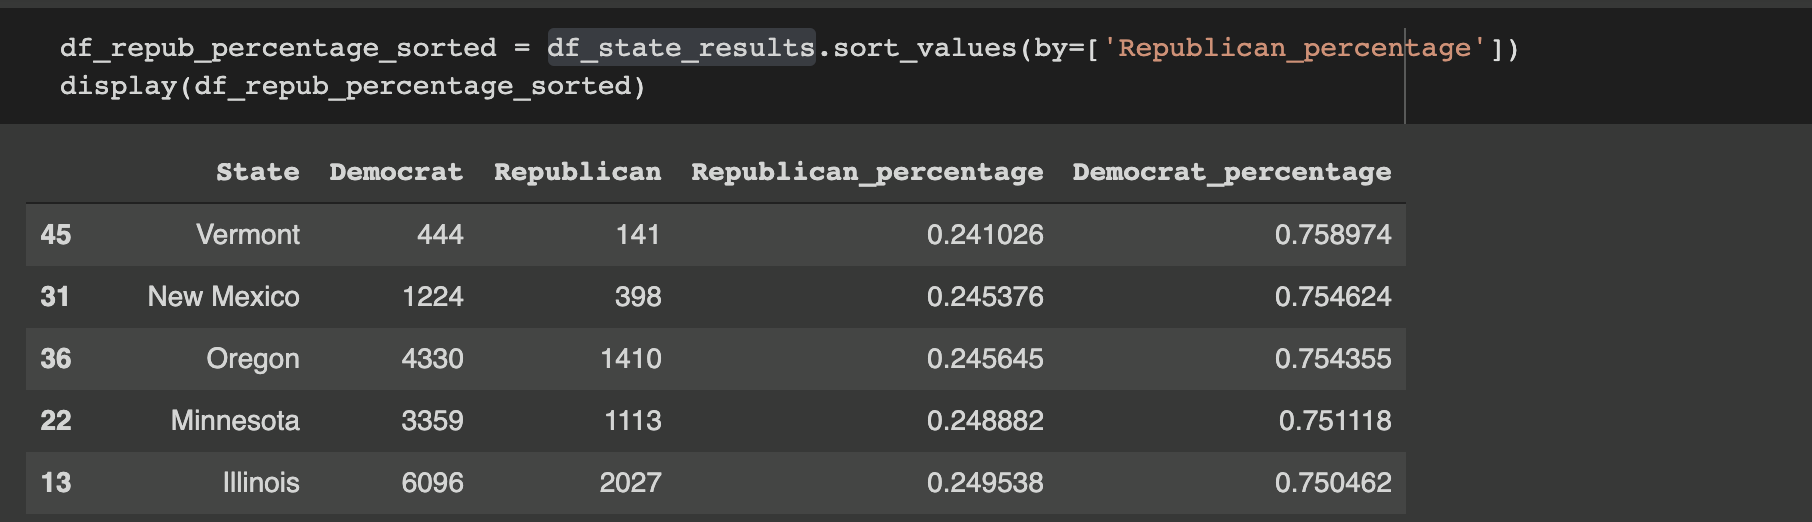
Despite this clear liberal bias, our results still clearly indicated which states had more dominant conservative tendencies.
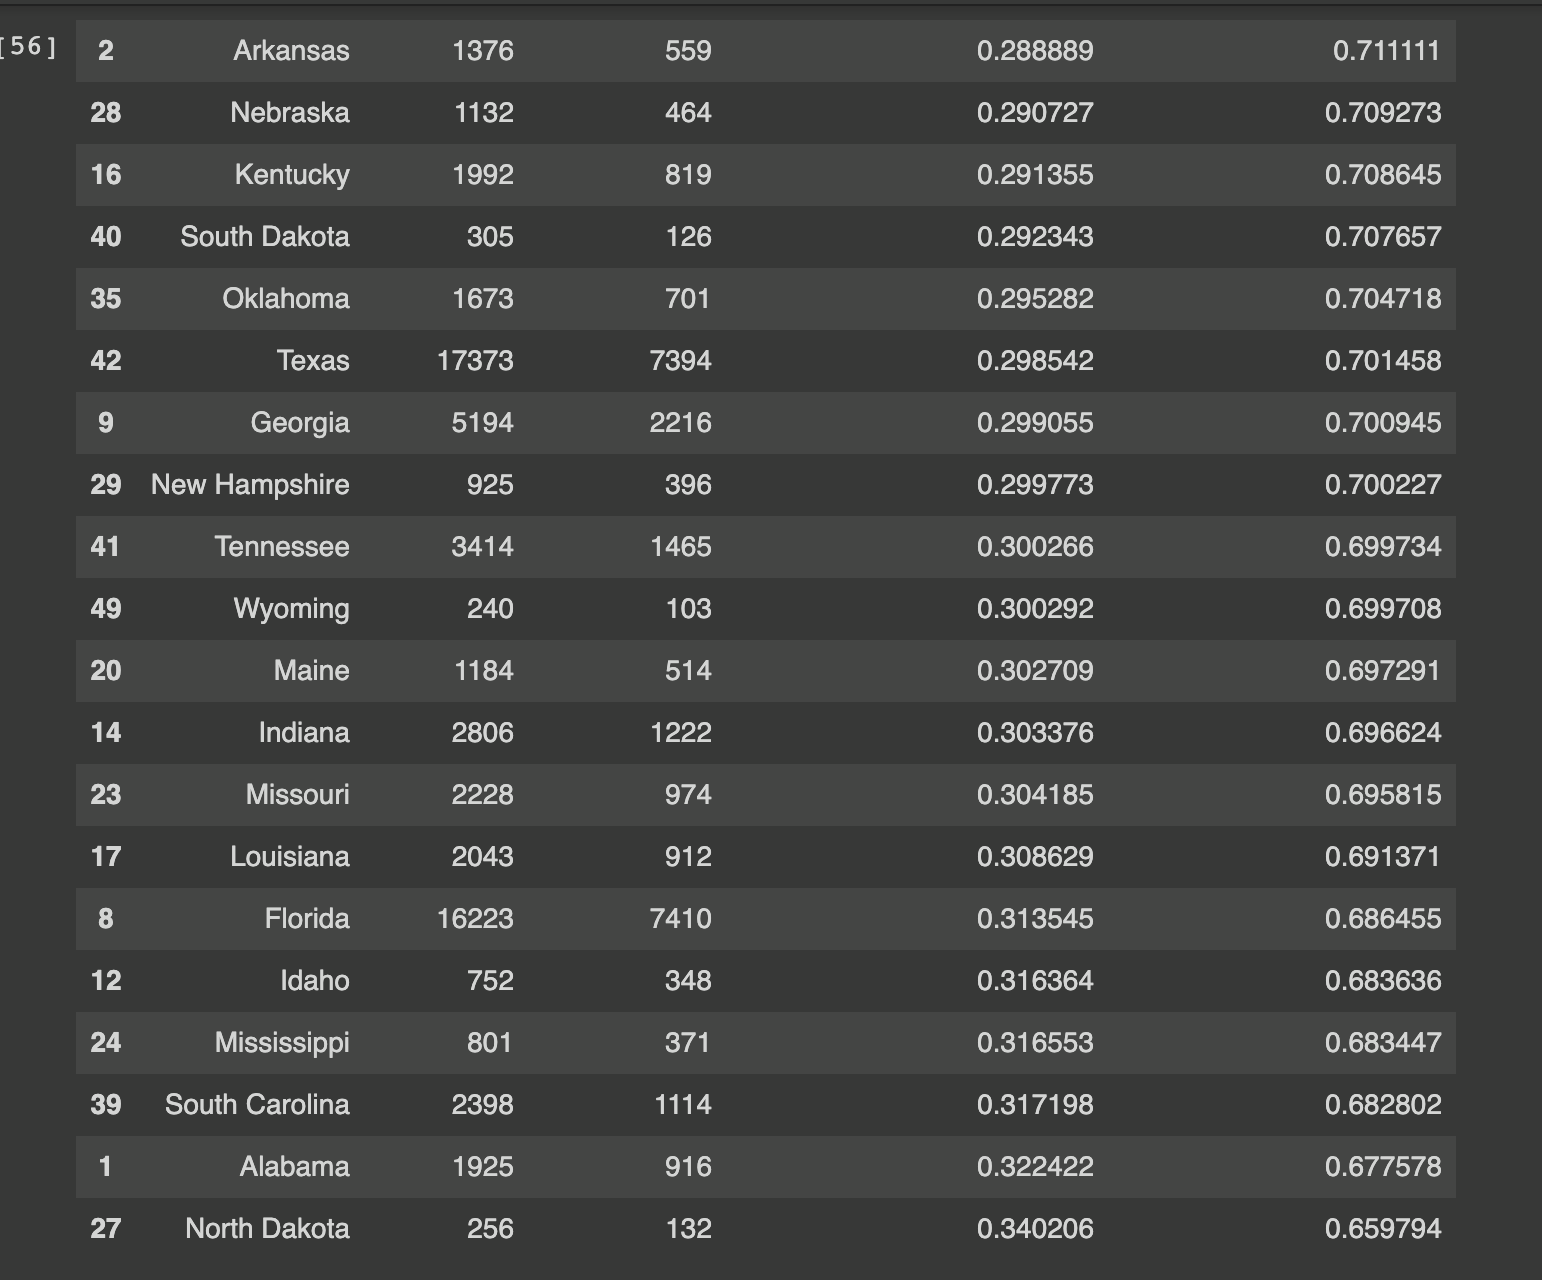
In the figure above, our dataset of election results by state is sorted by the states with the lowest percentage of Republican-affiliated tweets. Therefore, the states listed at the bottom of the list have the highest ratio of right leaning tweets. The majority of these states at the bottom of the list voted in favor of Trump in the 2020 Election. In fact, out of the twenty states shown in the figure, Trump only lost Maine and Georgia. When looking at the political climate of these states, we see that Maine allocates some electoral votes by Congressional District, and Trump received some of these votes. Additionally, Georgia was a highly contested state, which explains the larger portion of Republican tweets made there. Therefore, we can see that while Twitter’s user base is mostly Democratic, higher percentages of Republican tweets in a state indicate a stronger conservative leaning for that state.
The figure above shows the states with the most Democratic tweets. Comparing these to the actual election results, we can see that Biden won each state shown.
In conclusion, by applying our BERT model to a dataset of tweets and filtering each tweet by its location, we were able to recreate the 2020 US Presidential Election through Twitter. While the results were ultimately overwhelmingly Democratic, this was to be expected given Twitter’s demographic, but Republican states were still well represented by higher ratios of Republican tweets.
Conclusion
Throughout the course of this project, we had the chance to learn many skills in the NLP domain, such as topic modeling through various methods like LDA, fine-tuning language models on downstream tasks, among others. We also had to do a lot of data collection, which presented it’s own challenges such as integrating with the Twitter API and respecting its rate limits. Furthermore, using libraries like Ray Tune for hyperparameter tuning allowed us to learn about modern methods for intelligently optimizing hyperparameters of deep learning models.
One of the successes of this project was that we were able to create a novel labeled dataset for our task, gathering over 500,000 entries, which is comparable to the larger datasets in the GLUE benchmark, a classic NLP metric. We also managed to train multiple models into the .9+ AUC range and acheive accuracies in the high 80 percents, which indicates that we were successfully able to train accurate classifiers for broad political tweets.
In the future, given more time, we would like to try more complex models, such as an XGBoost model that can take into account BERT embeddings as well as tweet metadata, like hashtags. We would also like to fine-tune our election analysis to look at electoral districts as opposed to full states. Some things that we wanted to explore but could not were to explore with using XGBoost model trained on a dataset with the top 10 topics and bigrams as well as sentiments. We also expanded our natural language understanding, as well as generation, capabilities to describe a tweet understand and describe the key points in a tweet based on our topic models. These are future things to consider, and we hope to see others try it or to try it ourselves some other time.
Ultimately, we were able to achieve most of our goals for this project, and managed to show useful insights regarding analysis of tweets using NLP methods as well as regarding the political distribution of Twitter in the US.